1. Make sure you copy your plugin/workflow assembly (.dll) and .PDB files to the CRM server directory <crm-root>\Server\bin\assembly.
Typically, this is the folder ‘C:\Program Files\Microsoft CRM\server\bin\assembly’
Important: if your assembly depends on other .dlls and they are not registered on the GAC in the CRM Server (or want to debug them also), copy them also to the same directory.Note: if your assembly has already been deployed to that directory and need to update it, you may need to restart IIS in order to unlock it because it may be in use by the IIS process.
2. Register your assembly by selecting ‘on-disk deployment’ . This can be easily and intuitively done by using Plugin Registration Tool in CRM SDK.
3. Restart IIS on the CRM Server. Note that you may be need to do this before as mentioned above.
4. If not yet installed yet, you will need to install Visual Studio Remote Debugger component on the CRM Server. For doing so:
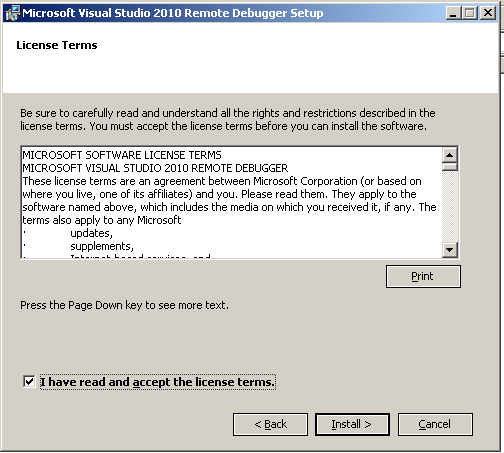
a. Within the Visual Studio 2010/2008 installation media (or ISO image) go to ‘Remote Debugger folder’.b. There you will find some setup files. Just double click the one that matches with your platform.c. Setup starts…d. Accept the licence terms..e. Installation starts..f. Once installation is completed, rebooting your machine will be required.



5. Now, let’s configure the Remote Debugger component by running the Visual Studio Remote Debugger Configuration Wizard.
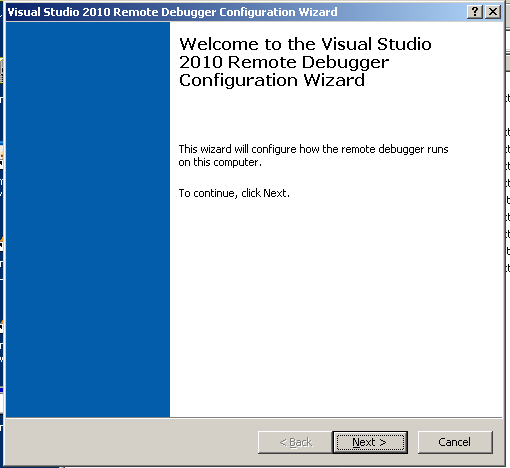
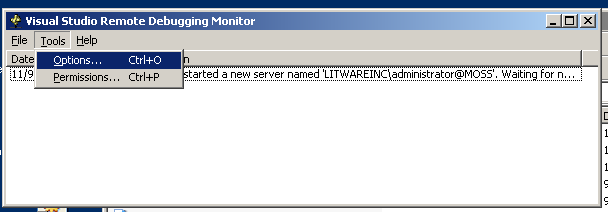
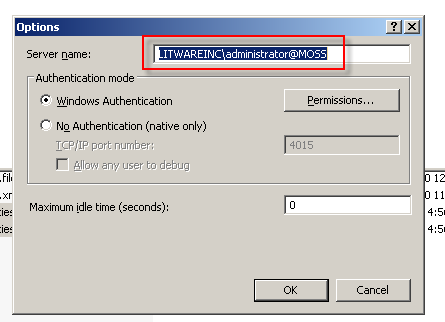
a. So, go to Start->All Programs->Microsoft Visual Studio 2010/2008->Visual Studio 2010/2008 Remote Debugger Configuration Wizard as shown in the picture below.b. Welcome screen shows up…c. We can configure to run Remote Debugger as a service or a Windows application.I recommend and chose the latter as its less invasive, less resource consuming and more secure because you explicitly start and stop this component. Moreover, by choosing the latter you can set up permissions and easily copy the server name for debugging purposes.d. Set up options and permissions by clicking in Tools->Options:e. Within Options Window, click on Permissions button to set up the users that will be allowed to remotely debug on the server:You will be able to add administrators as well as other users belonging to the Debugger Users group.Despite adding Everyone to this group and selecting it on this Windows is something not recommended for security reasons, it works fine and sometimes avoid problems that may occur in the middle while trying to debug (which usually responds to some urgent situation).
d. Now, copy the exact server name string which is displayed on Options window.This is very important as this is the string you will need to paste within your local Visual Studio in order to remotely connect to the CRM Server machine.e. Press OK to accept options. A message telling that the service has been started should be displayed on the main Visual Studio Remote Debugging Monitor window.



6. Open your local Visual Studio and set up the breakpoint(s) you want to monitor in your plug-in / workflow activity classes. It could also be breakponts in one of the dependent assemblies (as far as .PDB file are deployed to <crm-root>\Server\bin\assembly)
7. Attach Visual Studio to CRM Server remote working process, that is, remote w3wp.exe service (in case of plugins) and Crmasyncservice.exe (in case of workflow activities).
For doing so, press CTRL + ALT + P or select Debug->Attach to Process menu option…
8. Paste the server name string into the Qualifier field, as shown below:
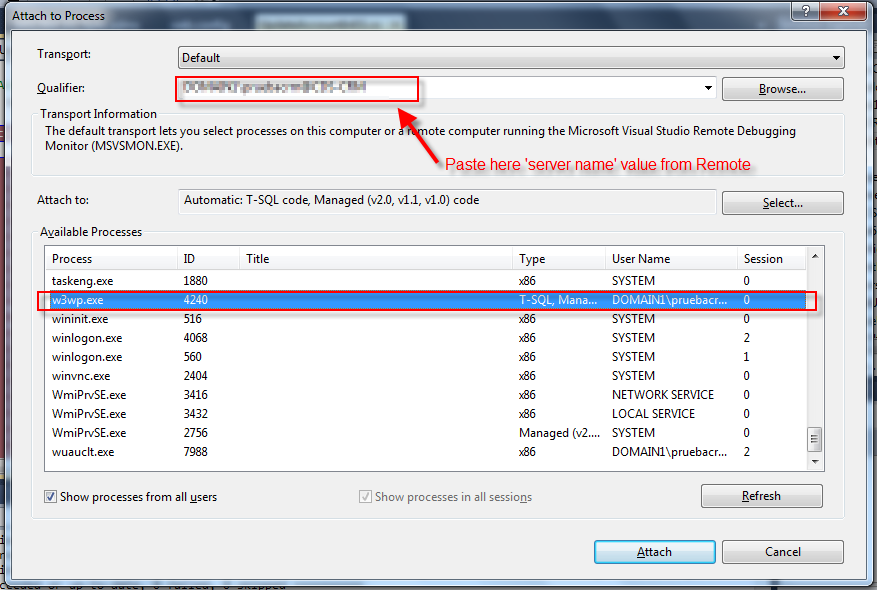
9. Select the w3wp.exe and/or Crmasyncservice.exe process .
10. Run your tests (i.e. modifying/creating some entity in order to make the plug-in being triggered).


No comments:
Post a Comment